
FromCSVtoSemanticModelinTableauNext
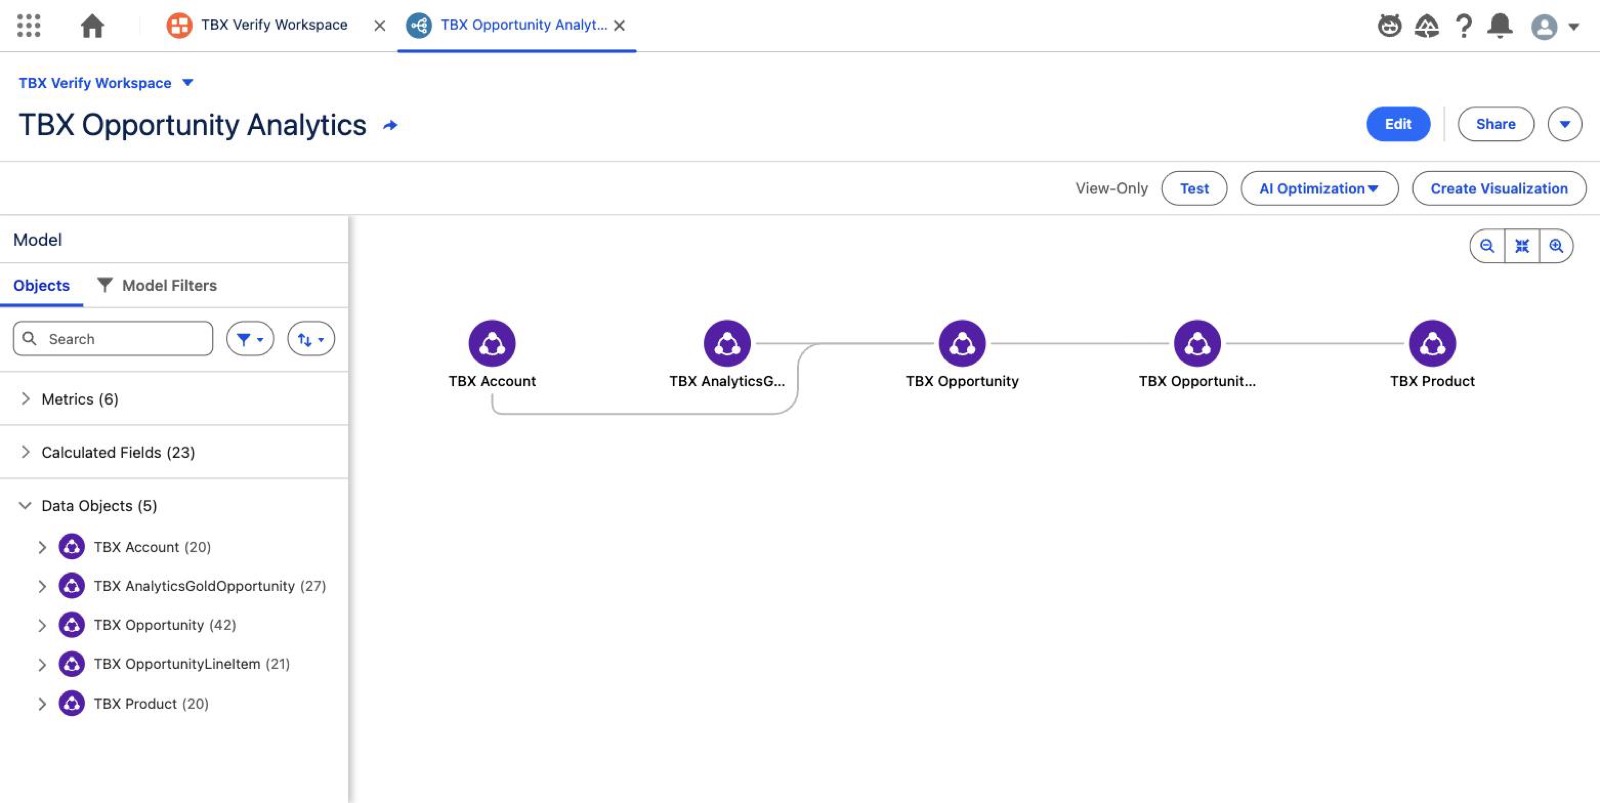
Tableau Next is Salesforce’s new generation of analytics, and under it sits Data 360, the data platform formerly known as Data Cloud. Between your spreadsheet and your first AI-answered question stands a route with a few genuinely permanent decisions along the way. We have run this route many times, in real orgs, with real mistakes made so you do not have to make them. This guide is the map.
The route has five waypoints: your CSV files become data streams, which land as data lake objects, which a semantic model organizes into meaning, which a workspace presents to your team. Visualizations and dashboards come after, and they come easier the better you do everything before them.
Before you load anything, audit your files
Here is the most important sentence in this guide: several choices you make at load time are permanent. Not annoying to change. Permanent. The category, the primary key, and the inferred field types on a data lake object cannot be changed after the stream is created. The repair path is deleting the stream and starting over, so five minutes of auditing beats an afternoon of rebuilding.
For every CSV, check three things:
- Pick the primary key, and prove it is unique. The upload wizard requires a primary key but never checks uniqueness. If your key column has duplicates, or blank cells, or the literal word NULL as a placeholder, rows will silently merge into one another and the load will still report success. Count distinct values yourself first.
- Confirm the key is the join key. A column can be perfectly unique and still be the wrong choice. If other tables reference this one, the primary key must be the column they actually reference.
- Check your headers and types. A misspelled header becomes a permanent column name. A numeric-looking column can arrive as text. If you load sibling files across years, their types must match each other exactly.
Files up to 2 GB and 1,050 columns will load fine. Anything over 100 MB just takes a little longer to ingest.
Load each file as a data stream
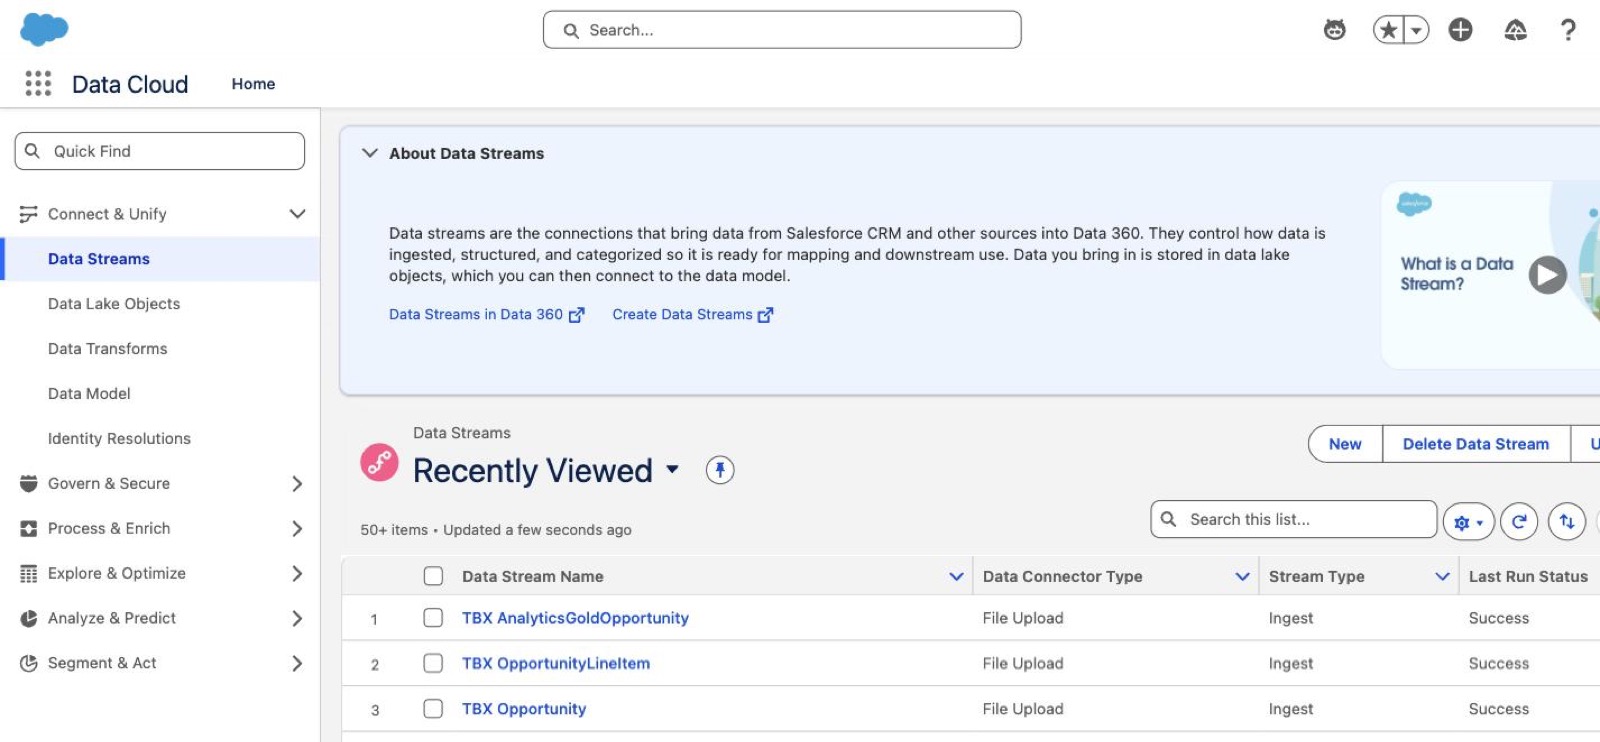
In Data 360, open Data Streams and choose New, then File Upload. The wizard walks you through screens that all matter, but three fields matter most, and all three are the permanent kind:
Category. The wizard defaults to Profile. Profile is meant for identity-resolved people and organizations, Engagement is for timestamped events, and Other is for reference data like products, calendars, and lookups. The dialog itself warns you this cannot change after saving, and it has billing implications.
Primary Key. Choose the column you audited. This single dropdown is what later makes many-to-one relationships work in your semantic model. Skip it and the platform mints a synthetic row ID you can never replace.
The object label. Your table arrives labeled with its filename, extension and all. That “.csv” will follow it into every field list, every agent answer, and every generated document unless you clean the label right here on the configuration screen.
Deploy, and the wizard stages your file and runs the first ingest automatically.
Verify like the number matters
A green Success status is a good sign, not proof. The honest check takes one minute and catches problems nothing else will surface:
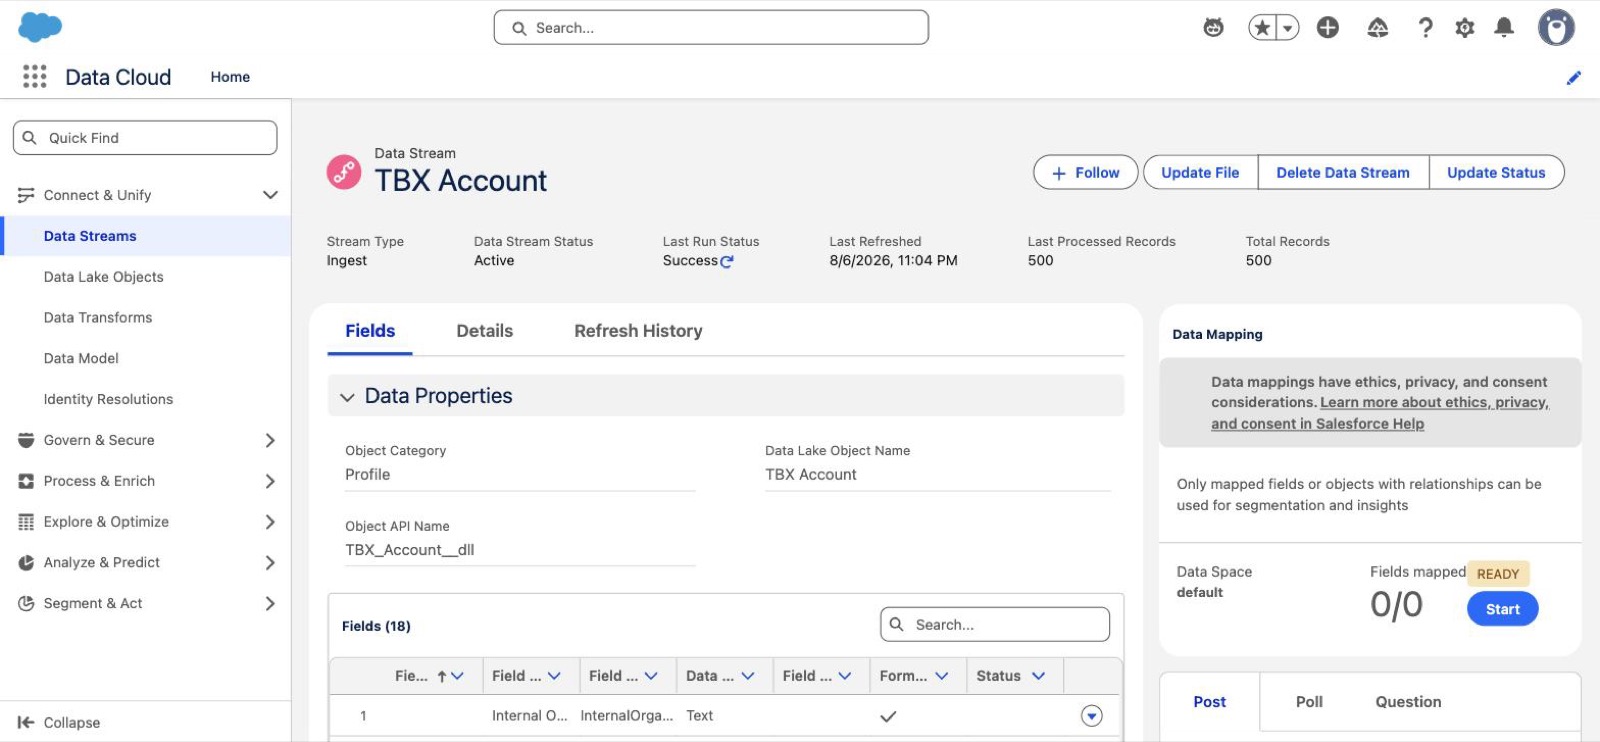
- Total Records must equal your file’s row count. Count the rows in the file yourself, then compare. If the platform reports fewer, your primary key had duplicates and rows were silently merged.
- Last Processed Records must equal Total Records. A gap between these two numbers is the only signal the platform gives you that deduplication happened. The run still says Success either way.
- Spot-check one real value. Open the data lake object and confirm the last row of your file actually arrived with its contents intact. Counts can match while content does not.
We keep a small log for every load: file name, row count, stream name, and both record counts. When all five of a project’s files show matching numbers, the foundation is proven, and everything built on top of it inherits that trust.
Build the semantic model
The semantic model is where columns become meaning. Create a model, add your data objects, and then spend your time on the three layers that decide whether your AI agent gives right answers:
Relationships. Connect child tables to parents with many-to-one cardinality, which works precisely because you set the primary key at load time. Keep the relationship graph acyclic: if two fact tables share several dimensions, pick one fact table as the hub. A cycle will be rejected at deploy, not before.
Descriptions. Every field and table description you write is context the agent reads when deciding which field answers a question. Keep each under 255 characters, mention synonyms your business actually uses, and describe what one row represents. This is the highest-leverage writing you will do all week.
Housekeeping. Hide the system and lineage fields that ride along with every file upload. They clutter every field list the agent considers. Set each table’s display-name field so records show up as names instead of IDs.
Then add calculated fields for the flags and amounts your questions depend on, and governed metrics on top of those. One rule saves the most grief here: a metric cannot slice below the grain of its measure. If a deal-level metric gets broken down by product, each deal counts once per product it contains and the total inflates. The self-check is simple, and worth teaching to everyone: a breakdown must add up to the same total as the whole.
Wire it into a workspace
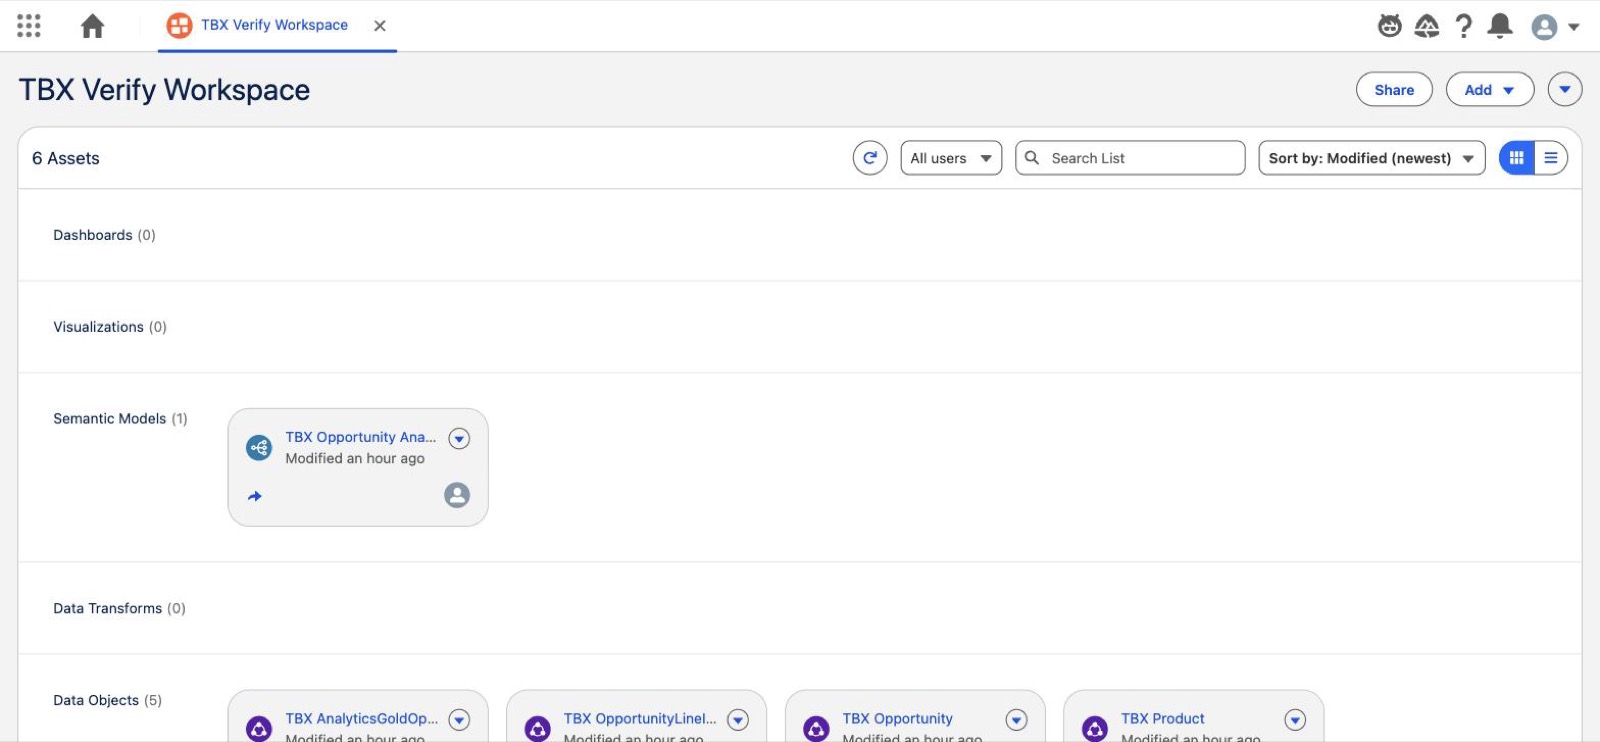
A workspace is a container of references, not copies. Create one, add your semantic model, and add the data objects too. Attach both, or the workspace will look half empty to your team.
From here, visualizations and dashboards are the human part of the craft, and honestly the fun part. Sketch what you want to see before you build it, agree on it with the people who will use it, and then build only that. The model you just finished is what makes every chart you draw and every question you ask land on solid ground.
The field notes we wish someone had handed us
- Validation passing proves nothing about answers. A model can validate clean and still compute the wrong number. Put a measure on a worksheet and check it against a total you computed independently before you trust it.
- Test the agent, not the model. Every real defect we have found came from asking live questions and checking the numbers, not from reading model definitions.
- Duplicate field labels cause silent wrong-field picks. If two tables both have a field labeled Amount, the agent cannot tell them apart, and no instruction can fix what it cannot distinguish. Rename for uniqueness.
- Deleting a stream does not delete its staged file. Fixing a wrong type or key means delete and recreate, and the recreate needs no re-upload. Cheap, fast, and much better than living with a wrong type forever.
Every step above was run live before it was written down. That is the standard we hold for everything on this shelf, and the same standard we bring when we teach it in person.